Customer Journey Analytics: How to Track and Optimize Every Touchpoint
Table of Contents▼
Your customers are telling you something during every interaction they have with your brand. The question is: are you listening all the time or just at the end when it’s too late to do anything about it?
Customer journey analytics uses data from various touchpoints and creates a complete picture of what your customers are experiencing. It tells you where they’re happy and where you’re losing them.
For multi-location brands, that’s harder than it sounds. You’ve got different teams, different managers, and different customer experiences. It’s all playing out simultaneously.
This guide will help you take control and become proactive. Learn:
- What customer journey analytics is and how it works
- Which touchpoints to track at each stage
- Which metrics tell you what’s working
- How to use the data to improve customer experience (CX)
What Is Customer Journey Analytics?
Customer journey analytics is the process of collecting and analyzing data. This data comes from every touchpoint a customer has with your brand, from the first time they hear about you to long after their initial purchase.
It tells you what customers are doing at each stage. It shows where they’re having a great experience and where they’re running into problems.
For multi-location brands, it shows you how the journey differs from one location to the next.
Journey analytics vs. journey mapping
These two terms are related, but they’re not quite the same:
- Journey mapping is a planning tool. You draw out what the customer experience should look like. It’s visual and qualitative.
- Journey analytics is a measurement tool. You track what the experience looks like using real customer data.
Let’s compare.
| Journey mapping | Journey analytics | |
| What it is | A diagram of the intended experience | Data from the actual experience |
| Based on | Assumptions and research | Real customer behavior and feedback |
| Output | A visual map | Scores, trends, and insights |
| Used for | Designing the experience | Measuring and improving it |
Why touchpoint-level data matters
Think about the last time a business genuinely impressed you. It was probably one specific moment that really stood out.
Maybe someone remembered your name. Or maybe a problem got fixed faster than you expected. Whatever it was, that moment is a touchpoint.
And those touchpoints are critical. Why? Because one great moment can turn a satisfied customer into a vocal advocate.
McKinsey research found that customers who experienced delight were significantly more likely to recommend that brand to others.
The flip side is also true. One bad moment can end a relationship.
That’s why tracking data at the touchpoint level matters. You can’t create more moments of delight if you don’t know which touchpoints are delivering them.
And you can’t fix the moments that are pushing customers away if you can’t see where they’re happening.
The competitive stakes are high as well. About 80% of organizations expect to compete on CX.
RELATED ARTICLE — How to Measure Customer Experience
How Customer Journey Analytics Works
Customer journey analytics collects data from multiple sources. It then connects it into a single picture of the customer experience.
Think of it like a movie. Each touchpoint is a scene. Customer journey analytics is the 120-minute film, complete with a beginning, middle, and end.
Many businesses only ever see individual scenes. Journey analytics lets you watch the whole thing.
Here’s how the process works at a high level:
- Data is collected from every customer touchpoint.
- That data is pulled together so you can see the complete journey, not just individual scenes or moments.
- Trends and problems are identified by stage and by location.
- Insights are used to make targeted improvements.
Let’s take a closer look.
Connecting data across touchpoints
If you’re like many businesses, you collect data in silos:
- Your online reviews live in one place.
- Your post-visit survey responses live in another.
- None of them talk to each other.
Connecting data across touchpoints means bringing all that data together. Here’s what that looks like in practice:
- A customer finds you through a Google search (acquisition data).
- They visit your location and rate their experience (survey data).
- They leave an online review two days later (review data).
- They contact support three weeks in (service data).
Identifying journeys & stages
Customer journey analytics is useful because it allocates your data to stages.
Your analytics platform collects data from every touchpoint. But raw data from every interaction at once is overwhelming.
Stages give that data structure. They tell you which part of the relationship each data point belongs to.
You can then see patterns by stage rather than trying to make sense of everything altogether.
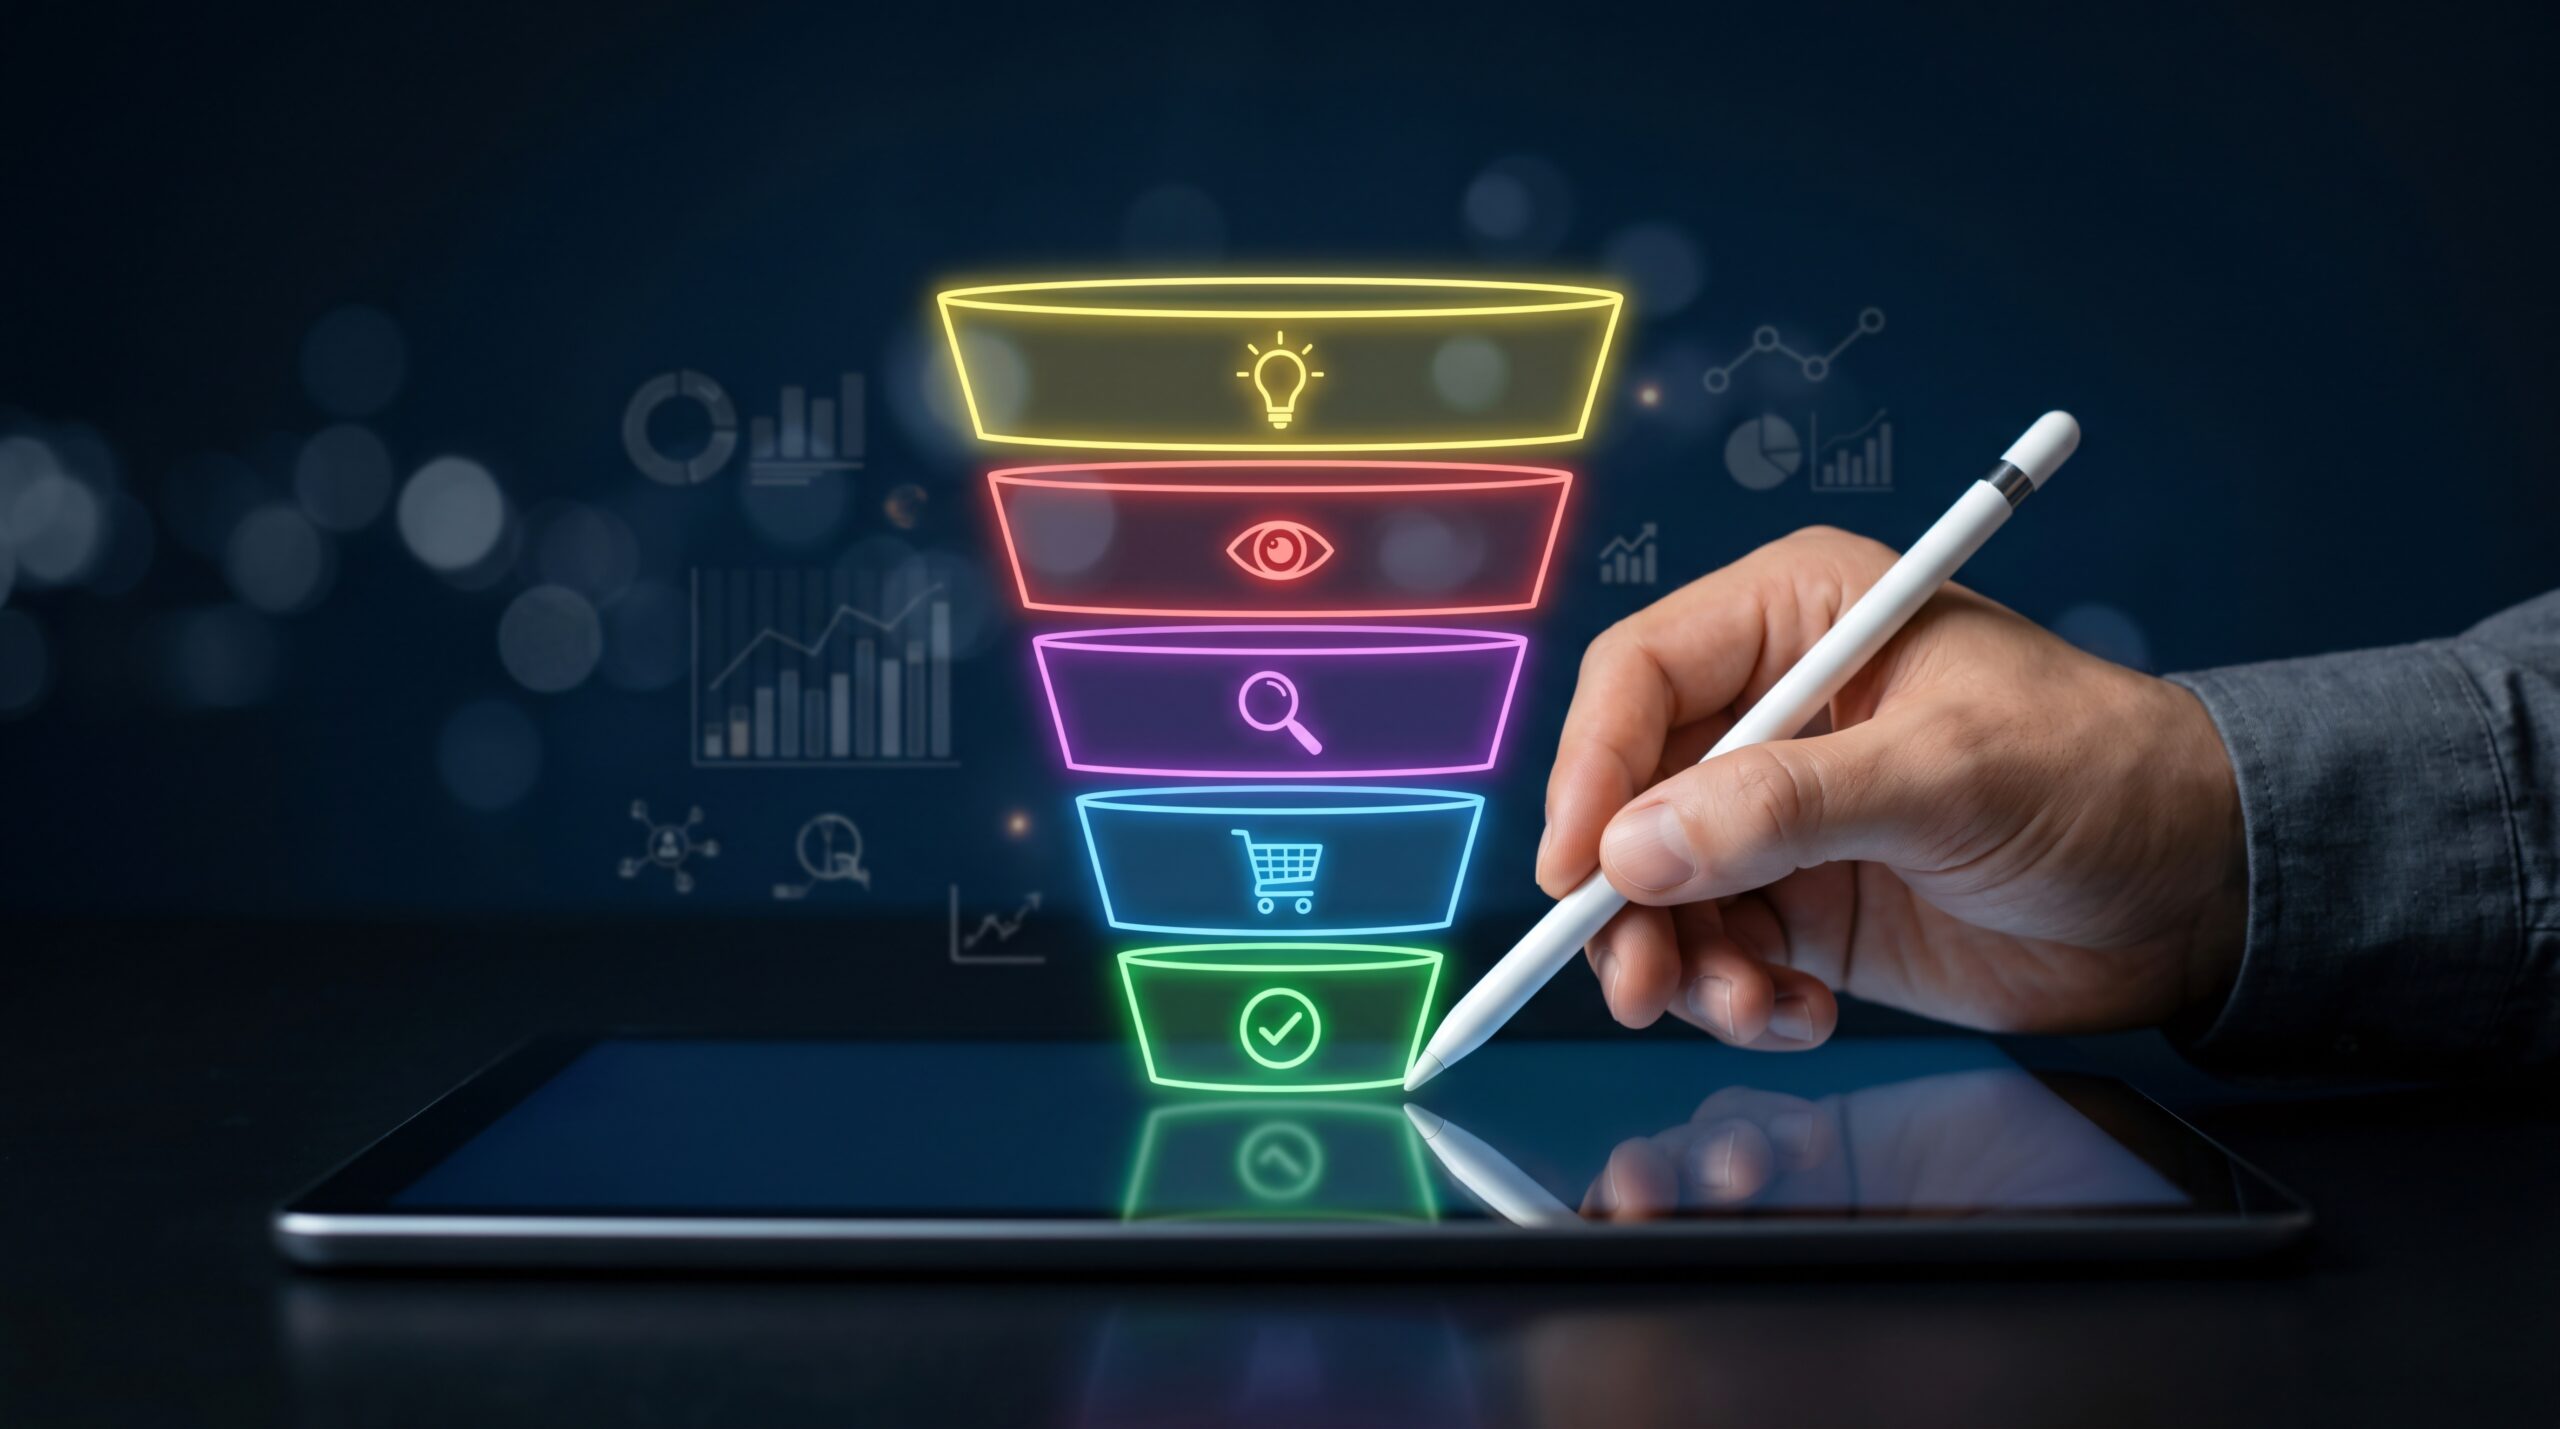
Here are the stages you’ll likely track:
| Stage | What’s happening |
| Awareness | The customer discovers your brand for the first time. |
| First visit or purchase | They try you and form their first real impression. |
| Ongoing service | They continue using your brand across multiple interactions. |
| Renewal or retention | They decide whether to be loyal or move on. |
Let’s say your post-visit satisfaction scores are strong but your renewal rate is dropping. Without stage-level structure, those two signals look unrelated.
But with it, you can diagnose a problem specifically at the retention stage. This is after the service is done but before the customer decides to come back.
Key Touchpoints to Track
Here are the touchpoints to look at in your customer journey tracking system.
Awareness & acquisition
Journey stage: Top of funnel. The customer is discovering your brand for the first time.
This is where the journey begins. A potential customer finds you through a Google search, a social media post, a referral from a friend, or an online ad.
They visit your website, read your reviews, and decide whether to take the next step.
Touchpoints to track at this stage include:
- Search and review visibility: What are people reading about you before they visit?
- Website behavior: Are visitors finding what they need or leaving quickly?
- First contact: When someone calls, emails, or walks in for the first time, how is that experience?
If customers are dropping off at this stage, they’re not converting into paying customers. Tracking awareness touchpoints tells you whether your first impression is working or not.
Purchase & onboarding
Journey stage: Mid-funnel. The customer has decided to buy and is getting started.
This stage covers the moment a customer makes a purchase. It encompasses everything that happens right after.
For a service business, that might be signing up, booking an appointment, or completing a first visit.
Here’s what to monitor:
| Touchpoint | What you’ll learn |
| Purchase experience | Was it easy to buy? Were there any friction points? |
| Welcome communication | Did the customer receive a warm, helpful introduction? |
| First visit or service experience | Did the reality match the expectation? |
| Post-purchase survey | How did the customer rate their first experience? |
A poor onboarding experience can be one of the top reasons customers don’t come back after a first purchase.
Tracking this stage tells you whether your new customers are starting on a positive note.
Service, support & renewal
Journey stage: Post-purchase. The customer needs help or is deciding whether to return.
This is the stage that determines long-term loyalty.
So, consider what happens when a customer has a problem. They call your location, send an email, maybe jump on live chat, or leave a review. What happens next decides whether they choose you again.
Interestingly, customers are 2.4 times more likely to stick with a brand when their problems are solved promptly. For a multi-location brand, slow or inconsistent support responses across locations can lead to lost customers and lost income.
Tracking this stage tells you whether your locations are resolving issues fast enough to retain the customers they’ve already won.
Keep an eye on these metrics:
- Support ticket volume and resolution time by location
- Renewal or rebooking rates
- Satisfaction scores after a service interaction
- Escalation rates and complaint patterns
- Average response time to negative feedback over locations
- Repeat contact rate: how often customers have to reach out more than once to get a resolution
RELATED ARTICLE — Voice of the Customer
Metrics & Signals in Journey Analytics
Knowing which touchpoints to track is the first step. The second is knowing exactly what to measure at each one.
Experience metrics (NPS, CSAT, CES) by stage
Experience metrics are scores that come directly from customers. They measure how a customer felt about a specific interaction or their overall relationship with your brand. Here are the three you’ll see most:
| Metric | What it stands for | What it measures | Best used at |
| NPS | Net Promoter Score | How likely a customer is to recommend you | Post-purchase, renewal stage |
| CSAT | Customer Satisfaction Score | Satisfaction with a specific interaction | After a service call, visit, or support ticket |
| CES | Customer Effort Score | How easy it was to get something done | Onboarding, support, purchase stage |
What to look for at each stage:
- Awareness and acquisition: Low NPS scores might show that your brand reputation or first impression needs attention.
- Purchase and onboarding: A low CES score tells you the buying or sign-up process is harder than it should be.
- Service and support: A low CSAT after a support interaction is a warning that your resolution process is not performing as it should be.
- Renewal: A dropping NPS trend could mean customers are losing confidence in your brand.
Behavioral & operational signals
Experience metrics tell you how customers rate their journey.
Behavioral and operational signals tell you what customers are actually doing and how your business is responding. These are the numbers behind the scores.
Key signals to track include the following:
- Repeat visit or rebooking rate by location
- Time between first and second purchase
- Average resolution time on support requests
- Survey response rate (low response can equal low engagement)
- Abandonment rate at key steps in the purchase process
- Escalation frequency by location
- Staff response time to negative feedback alerts
How to Use Journey Analytics to Optimize CX
Analytics is only useful when it leads to action. Here’s how to take your data and turn it into meaningful improvements.
Find friction & drop-off points
Friction is anything that makes the customer’s journey harder than it needs to be. A drop-off point is where customers stop engaging, stop returning, or walk away entirely.
Here’s how to find them:
- Step 1: Look at your metrics for each stage of the journey separately. Don’t average everything together. You want to see where the scores drop or where behavioral signals change.
- Step 2: Read through your open-text survey responses and online reviews. Group similar complaints together to find your friction points.
- Step 3: Cross-reference your scores with behavior. For example, a decrease in CSAT at the service stage plus a low rebooking rate at the same location tells you something is going wrong after the first visit.
- Step 4: Map the friction to a specific touchpoint. Don’t stop at “service is poor.” Pinpoint exactly where. Is it the wait time? The staff interaction? The follow-up communication? The more specific you get, the easier it is to fix.
Prioritize high-impact fixes
You won’t be able to fix everything in a week or two. Instead, make it your goal to prioritize the changes that will have the biggest impact on customer retention and satisfaction.
Rate each friction point on two things:
- How often does it happen? A problem that affects 40% of customers at a location is more urgent than one affecting 5%.
- How much does it affect loyalty? A friction point at the renewal stage has a bigger impact on revenue than one at the awareness stage.
Fix the high-frequency, high-impact problems first.
Document what you changed and when. Plus, track whether the relevant metric improves in the following four to six weeks.
Close the loop with customers
Closing the loop means following up with customers who left negative feedback. It’s one of the highest-return actions you can take with your journey data.
Follow this process:
- Set up an alert for any survey response below a threshold score, such as below 7 out of 10.
- Assign that alert to a specific person at the relevant location.
- That person contacts the customer within 24 hours to acknowledge the experience and offer a resolution.
- Log the outcome so you can track whether the same issue keeps coming up.
RELATED ARTICLE — How to Track Customer Feedback
Customer Journey Analytics for Multi-Location Brands
Journey analytics gets more complex when you have multiple locations.
The customer journey at one location can look completely different from another, and a network-wide average score won’t tell you that.
Comparing journeys across locations
To compare journeys across locations, you need to scrutinize the same analytics for each location. Then, look at the results side by side.
Here’s how to do it:
- Set up the same survey and feedback process at every location.
- Tag all responses with the location where the interaction happened.
- Generate a monthly report that shows each stage of the journey by location.
- Sort locations by score so you can see who’s leading and who’s falling behind.
Brand-level vs. location-level views
There are two different ways of looking at the same data: at the brand level and at the location level.
| Brand-level view | Location-level view | |
| What it shows | Average performance for all locations | Performance at each individual location |
| Good for | Identifying overall trends | Finding specific problems |
| Risk of relying on it alone | Strong locations can hide weak ones | May miss network-wide patterns |
| Best used for | Executive reporting and strategy | Coaching, accountability, and operations |
Say you run eight locations and your brand-level CSAT is about 8 out of 10. That sounds pretty good, right?
But when you break it down by location, you find that six locations are scoring between 8 and 10, one is scoring 6, and one is scoring 4. That lowest location is losing customers.
Without the location-level view, you’d never know.
Customer Journey Analytics Software
Tracking journeys manually across more than one or two locations just isn’t viable. Customer journey analytics software brings all your data together automatically.
What to look for
The right software needs to work for a distributed operation. Here are five features to look for:
- Multi-location reporting with location-level filtering
- Automated post-visit survey delivery by email or SMS
- Real-time alerts for negative feedback
- Sentiment analysis on open-text responses
- Trend tracking over time by stage and by location
AI-powered journey insights
A good feedback analytics platform uses AI to do the heavy lifting.
Forget reading thousands of comments manually. AI distills them into trend summaries, flags emerging issues, and uncovers problems you might have otherwise missed.
The results?
- Fewer data errors
- Faster responses
- More consistent experiences
- Greater brand loyalty
- More time to spend on mission-critical and growth-driving tasks
Frequently Asked Questions
Have questions about tracking and using customer journey analytics? We’ve answered a couple of the most asked ones below.
What is customer journey analytics?
Customer journey analytics is the collection and analysis of data. This data comes from all the different touchpoints a customer has with your brand throughout the relationship.
It tells you what customers are doing at each stage of their journey. It also flags where they’re having a great experience and what that looks like, as well as the moments they come up against problems.
How is it different from journey mapping?
Journey mapping is a planning tool. You work with your team to document every step of the customer experience and agree on what good looks like. It’s based on assumptions and internal knowledge.
Journey analytics takes that same journey and measures it with data. Rather than what you think customers experience when they call your location or visit your website, you learn exactly what they rated it or said about it.
What tools are used for journey analytics?
The best customer feedback software typically includes:
- Post-visit survey tools
- Multi-location reporting dashboards
- Sentiment analysis on customer comments
- Real-time alerts for negative feedback
Conclusion
Customers are the heart of your business. Journey analytics helps you better understand what they experience as they interact with your brand.
That said, the data alone won’t change anything. It’s what you do with it that determines whether your customers become loyal or take their business somewhere else.
If you act on your journey data, you can win more customers and lose fewer. You can create a five-star reputation that’s consistent across all your locations.
Sound good? Why not get started today?
- List every touchpoint in your customer journey. Jot them down in order from first contact to renewal.
- Pick your lowest-performing location and read every review it received in the last 30 days. Can you spot a theme?
- Check whether your current feedback data is tagged by location. If it isn’t, fix it as soon as possible.
- Research software solutions that can make the tracking and analysis process easier and more powerful.